2D Fourier transform
[10]:
import numpy as np
import matplotlib.pyplot as plt

from deconvoluted import fourier_transform
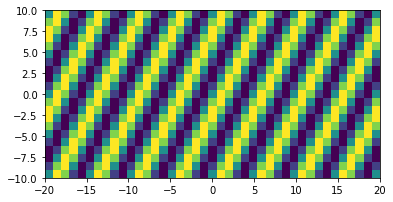
Suppose we want to compute the 2D fourier transform \(F(p, q)\) of a function \(f(x, y)\). Let us generate some data which has a frequency of \(0.2\) Hz in the \(x\) direction, and \(0.1\) Hz in the \(y\) direction:
[11]:
x = np.linspace(-20, 20, 41)
y = np.linspace(-10, 10, 21)
X, Y = np.meshgrid(x, y)
f_xy = np.sin(0.2 * 2 * np.pi * X + 0.1 * 2 * np.pi * Y)

plt.imshow(f_xy, extent=(x.min(), x.max(), y.min(), y.max()))
plt.show()

Taking the transform is now simply a matter of calling fourier_transform:
[12]:
F_pq, p, q = fourier_transform(f_xy, x, y)
[13]:
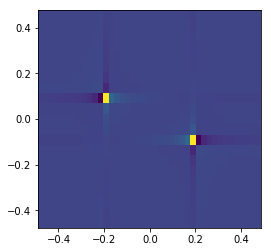
plt.imshow(F_pq.real, extent=(p.min(), p.max(), q.min(), q.max()))
plt.show()

We see two resonances, exactly where we would expect them!